不是0基础小白教程 目的:收集系统中指定文件的日志,推送至Loki,并在Grafana中查看
Loki + Grafana配置
Docker Compose
services:
  grafana:
    image: grafana/grafana:latest
    container_name: grafana
    environment:
      - GF_SERVER_ROOT_URL=https://grafana.vio.vin
    volumes:
      - ./grafana:/var/lib/grafana
      - ./grafana-config/grafana:/etc/grafana
    # ports:
    #   - "3000:3000"
    network_mode: host
    restart: unless-stopped
  loki:
    image: grafana/loki:latest
    # ports:
    #   - "3100:3100"
    command: -config.file=/etc/loki/local-config.yaml
    volumes:
      - ./loki-config/loki-config.yaml:/etc/loki/local-config.yaml
    network_mode: host
restart: unless-stoppedLoki配置文件
文件位于 loki-config/loki-config.yaml
基于官方配置文件示例,修改了对日志推送频率的限制
auth_enabled: false

server:
  http_listen_port: 3100
  grpc_listen_port: 9096
  log_level: debug
  grpc_server_max_concurrent_streams: 1000

common:
  instance_addr: 127.0.0.1
  path_prefix: /tmp/loki
  storage:
    filesystem:
      chunks_directory: /tmp/loki/chunks
      rules_directory: /tmp/loki/rules
  replication_factor: 1
  ring:
    kvstore:
      store: inmemory

query_range:
  results_cache:
    cache:
      embedded_cache:
        enabled: true
        max_size_mb: 100


limits_config:
  reject_old_samples: true
  reject_old_samples_max_age: 168h
  ingestion_rate_mb: 100
  ingestion_burst_size_mb: 100
  per_stream_rate_limit: 100MB
  per_stream_rate_limit_burst: 200MB
  max_query_series: 10000000
  max_streams_per_user: 0
  max_label_names_per_series: 10000000


schema_config:
  configs:
    - from: 2020-10-24
      store: tsdb
      object_store: filesystem
      schema: v13
      index:
        prefix: index_
        period: 24h

pattern_ingester:
  enabled: true
  metric_aggregation:
    loki_address: localhost:3100

ruler:
  alertmanager_url: http://localhost:9093

frontend:
encoding: protobufFluent Bit配置
vi /etc/fluent-bit/fluent-bit.conf[SERVICE]
Flush 1
Daemon Off
Log_Level debug
Coro_Stack_Size 24576
storage.metrics on
[INPUT]
Name tail
Path /var/log/nikki/core.log
Tag nikki.core
Read_from_Head false
DB /etc/fluent-bit/flb_nikki.db
Rotate_Wait 5
Skip_Long_Lines On
Refresh_Interval 5
mem_buf_limit 50MB
Buffer_Chunk_Size 1MB
Buffer_Max_Size 20MB
storage.type memory
Docker_Mode Off
[FILTER]
Name modify
Match nikki.core
Add host ${HOSTNAME}
Add source openwrt
Add filename /var/log/nikki/core.log
[OUTPUT]
Name loki
Match nikki.core
Host 10.115.15.25
Port 3100
Labels job=nikki,source=openwrt,filename=core.log
Auto_Kubernetes_Labels Off
compress gzip
workers 2
tenant_id fake[SERVICE]
Flush 1:每 1 秒钟将缓存的日志刷新(发送)一次。Daemon Off:以前台模式运行,不作为守护进程。Log_Level debug:日志级别设为 debug,用于调试。Coro_Stack_Size 24576:协程栈大小(调优参数,防止复杂过滤器栈溢出)。storage.metrics on:启用内部存储指标监控。
[INPUT]
Name tail:使用 tail 插件,从文件尾部持续读取日志。Path /var/log/nikki/core.log:要监控的日志文件路径。Tag nikki.core:给这类日志打上标签,用于匹配过滤和输出。Read_from_Head false:不从头读起,只读取新追加的日志。DB /etc/fluent-bit/flb_nikki.db:保存读取进度的数据库文件,防止重启重复读取。Rotate_Wait 5:文件轮转后等待 5 秒再重新打开。Skip_Long_Lines On:跳过过长的日志行,防止内存问题。Refresh_Interval 5:每 5 秒扫描一次新文件或轮转文件。mem_buf_limit 50MB:输入插件的内存缓存上限。Buffer_Chunk_Size 1MB/Buffer_Max_Size 20MB:每次缓存块的大小及最大允许块大小。storage.type memory:只用内存缓存(不落盘)。Docker_Mode Off:非 Docker 容器日志模式。
[FILTER]
Name modify:使用 modify 过滤器。Match nikki.core:只匹配标签为nikki.core的日志。Add host ${HOSTNAME}:添加字段host,值为主机名。Add source openwrt:添加字段source。Add filename /var/log/nikki/core.log:添加字段filename。
[OUTPUT]
Name loki:输出到 Loki。Match nikki.core:匹配输入标签为nikki.core的日志。Host 10.115.15.25/Port 3100:Loki 的地址和端口。Labels:定义 Loki 标签(相当于 Prometheus 的 label),方便查询。Auto_Kubernetes_Labels Off:关闭自动从 K8s 获取标签。compress gzip:发送前启用 gzip 压缩。workers 2:启用两个并发 worker 线程加快发送。tenant_id fake:多租户 Loki 的 tenant ID(此处为fake)。
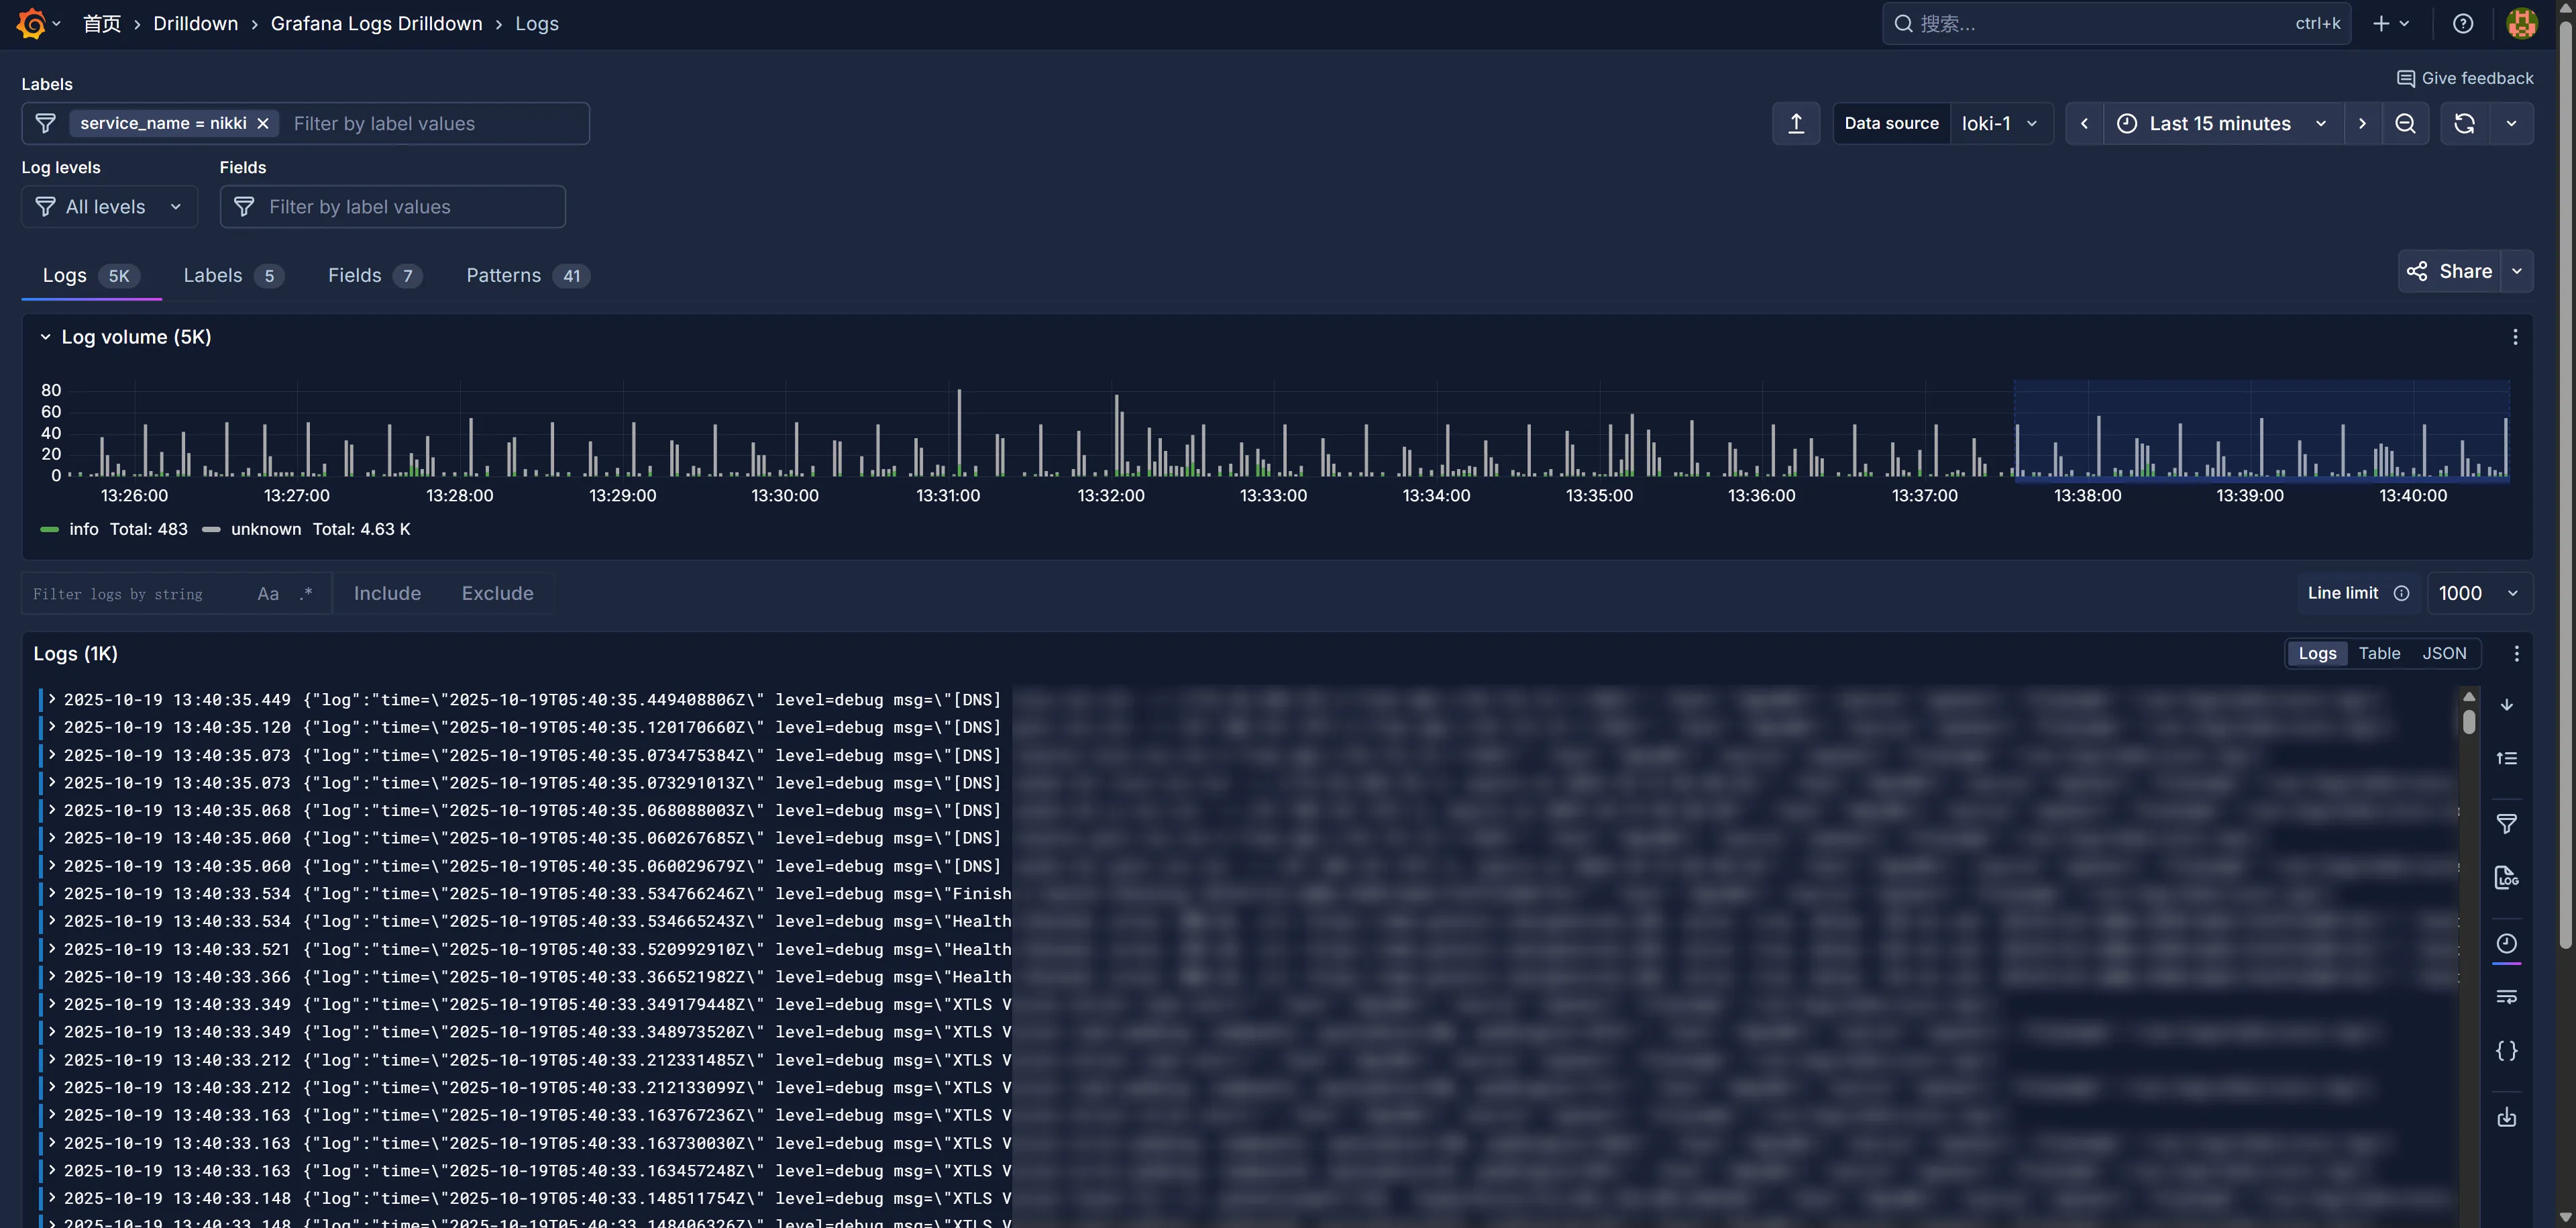
Grafana查询